Data centers consume approximately 2% of all electricity in the United States, and that figure continues climbing as computing demands increase. Within these facilities, cooling systems represent one of the single largest energy expenses—typically consuming 30-50% of total facility power. Yet many data centers unknowingly waste significant cooling capacity through inefficiencies that, once identified and corrected, could reduce operating costs by 20-40% without any compromise to reliability or performance.
The problem isn’t always obvious. A data center might maintain adequate temperatures while simultaneously wasting enormous amounts of energy through bypass airflow, demand fighting between cooling units, overcooling, hot spots requiring compensatory measures, or poor airflow management. These hidden inefficiencies drive up power bills month after month, year after year, representing tens or hundreds of thousands of dollars in unnecessary expenses.
This comprehensive cooling efficiency audit checklist provides data center operators with a systematic approach to identifying and quantifying energy waste in their cooling infrastructure. By working through these evaluation categories, facilities can uncover specific opportunities for improvement, prioritize actions based on potential savings, and implement changes that deliver measurable results.
Understanding Power Usage Effectiveness (PUE)
Before diving into the audit checklist, it’s essential to understand the primary metric for measuring data center efficiency: Power Usage Effectiveness, or PUE. This ratio, developed by The Green Grid consortium, provides a standardized way to assess how efficiently a data center uses energy.
The PUE Formula:
PUE = Total Facility Energy / IT Equipment Energy
An ideal PUE of 1.0 indicates that all consumed power goes directly to IT equipment with zero overhead for cooling, power distribution, or other infrastructure. In practice, most data centers operate with PUE values between 1.3 and 2.0. The industry-wide average currently sits at approximately 1.56 according to the Uptime Institute’s 2024 Global Data Center Survey, while leading hyperscale facilities achieve PUE values as low as 1.1 through advanced efficiency practices.
Every 0.1 improvement in PUE represents significant cost savings. For a data center consuming 1 megawatt of IT load with a PUE of 1.6, improving to 1.5 would reduce total facility power from 1.6 MW to 1.5 MW—saving 100 kilowatts continuously. At typical commercial electricity rates, this translates to savings of $70,000-$100,000 annually.
The inverse of PUE is Data Center Infrastructure Efficiency (DCiE), calculated as IT Equipment Energy / Total Facility Energy and expressed as a percentage. A PUE of 1.6 equals a DCiE of 62.5%, while a PUE of 1.3 equals a DCiE of 77%.
Measuring Your Baseline PUE:
To calculate PUE accurately, you need two measurements:
- Total facility power consumption, measured at the utility meter or calculated from all power entering the data center
- IT equipment power consumption, typically measured at power distribution units (PDUs) serving racks
PUE should be measured regularly—ideally continuously, but at minimum on a consistent schedule across different times and days to account for load variations. A single PUE measurement provides limited value; tracking PUE over time reveals trends and validates the impact of efficiency improvements.
The Cooling Efficiency Audit Checklist
This checklist organizes cooling system evaluation into categories addressing the most common sources of energy waste. Work through each section systematically, documenting current conditions and identifying opportunities for improvement.
1. Airflow Management Assessment
Poor airflow management represents one of the most common and costly inefficiencies in data centers. Research by the Uptime Institute found that in typical facilities, only 40% of supplied cooling air actually cools IT equipment—the remaining 60% is wasted through bypass airflow and recirculation.
□ Hot Aisle / Cold Aisle Configuration
Verify that server racks are arranged in alternating hot aisle and cold aisle rows, with all equipment facing the same direction within each aisle. Equipment intakes should face cold aisles and exhausts should face hot aisles. Incorrect orientation causes equipment to draw hot air, reducing cooling effectiveness and forcing cooling systems to work harder.
□ Containment Systems
Evaluate whether hot aisle or cold aisle containment is implemented. Containment physically separates hot and cold air streams, preventing mixing that wastes cooling capacity. Hot aisle containment encloses the hot exhaust air, directing it back to cooling equipment returns. Cold aisle containment encloses the cold supply air, ensuring it reaches equipment intakes. Studies show containment can improve cooling effectiveness by 20-40%.
□ Blanking Panels
Inspect all server racks for unused rack units (empty spaces between equipment). Every open rack unit allows cold air to bypass equipment, mixing with hot return air and reducing cooling efficiency. Installing inexpensive blanking panels ($7-$15 per 1U panel) can yield 1-2% energy savings per rack. A single 12-inch blanking panel can reduce rack temperatures by up to 20°F.
□ Cable Penetrations and Floor Openings
Examine raised floor tiles for unsealed cable cutouts and openings. Even a small 6″ x 12″ unsealed opening can bypass enough cold air to reduce cooling capacity by approximately 1 kilowatt. Check all floor penetrations, cable entry points, and spaces between racks for air leakage. Floor grommets and sealing materials cost $40-$125 but prevent significant energy waste.
□ Perforated Tile Placement
Verify that perforated floor tiles are located only in cold aisles, directly in front of equipment intakes. Tiles in hot aisles or in areas without equipment waste cooling capacity. Match tile perforation percentage to the cooling requirements of the equipment above—high-density racks may need 56% perforation while lower-density areas might use 25% perforation. Inappropriate tile selection can create hot spots or waste cooling capacity.
□ Obstructions and Blockages
Inspect for objects blocking airflow: equipment temporarily stored in aisles, boxes, maintenance carts, excessive cable bundles under raised floors, or debris in air paths. Remove all obstructions. Ensure cable management doesn’t create dense barriers that impede airflow through racks.
2. Temperature and Humidity Management
Many data centers waste energy by overcooling—maintaining temperatures well below what equipment actually requires. Understanding current conditions and adjusting set points appropriately can deliver immediate savings.
□ Current Temperature Measurements
Measure server inlet temperatures at multiple points within each rack—top, middle, and bottom at the front of equipment (approximately 2 inches from equipment intakes). ASHRAE recommends these measurement locations to identify hot spots that might be missed by room-level sensors. Document current temperature ranges across all racks.
□ ASHRAE Guideline Compliance
Compare measured temperatures against ASHRAE recommendations for your equipment class:
- Class A1 (most enterprise servers): Recommended 64-81°F (18-27°C), Allowable 59-90°F (15-32°C)
- Class A2 (modern servers): Similar to A1 with expanded humidity tolerance
- High-density servers: Recommended 64-72°F (18-22°C)
If all measurements fall well below the recommended range, the facility is likely overcooling. Data centers can save approximately 4% in energy costs for every 1°F increase in server inlet temperature.
□ Temperature Set Point Optimization
Review cooling unit set points. Many facilities still operate at legacy set points (68-72°F) established when equipment was more temperature-sensitive. Modern servers can safely operate at higher inlet temperatures. Consider raising set points gradually (1-2°F increments) while monitoring equipment temperatures to ensure adequate cooling throughout the facility.
□ Humidity Controls
Verify that humidity levels fall within ASHRAE recommendations: 20-80% relative humidity with a dew point range of 5.5°C to 15°C (41.9°F to 59°F). Maintaining humidity too low wastes energy through excessive dehumidification. Humidity too high risks condensation. Modern equipment is less humidity-sensitive than older systems, allowing for broader acceptable ranges.
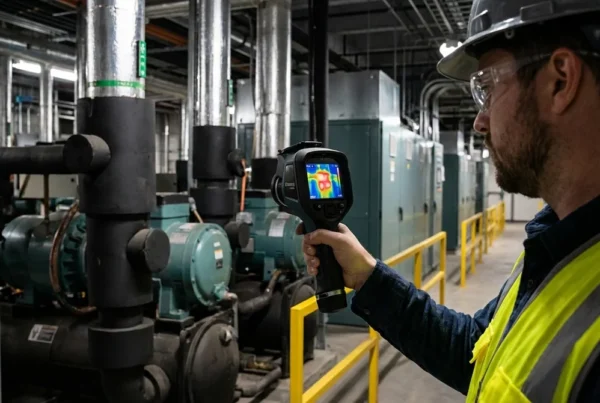
□ Hot Spot Identification
Use thermal imaging or wireless temperature sensor networks to identify hot spots—localized areas where equipment receives insufficient cooling. Hot spots force facilities to over-cool the entire space to protect vulnerable areas. Once identified, hot spots can often be resolved through airflow management improvements rather than additional cooling capacity.
□ Cold Spot Assessment
Identify areas receiving excessive cooling (cold spots), which waste energy. Thermal imaging reveals these areas as unnecessarily cold zones. Adjust perforated tile placement, reduce tile perforation percentage, or redirect airflow to eliminate cold spots.
3. Cooling Equipment Performance
Cooling equipment itself can harbor multiple inefficiencies, from demand fighting between units to poor maintenance reducing capacity.
□ Cooling Unit Capacity Verification
Calculate total cooling capacity installed versus actual heat load (remember: 1 Watt of IT power generates 1 Watt of heat requiring removal). Many facilities operate with 2-3 times the cooling capacity actually needed, with excess capacity running continuously and fighting against other units. Identify opportunities to turn off unnecessary units while maintaining adequate redundancy.
□ Demand Fighting Assessment
Demand fighting occurs when cooling units work against each other—one unit cooling while another heats, or one humidifying while another dehumidifies. This typically happens when units have inconsistent set points or poor coordination. Check that all cooling units serving an area have identical temperature and humidity set points. Verify that units are not simultaneously operating in opposing modes. Demand fighting can reduce cooling system efficiency by 20-30%.
□ Unit Staging and Sequencing
Evaluate how cooling units are brought online and taken offline as loads change. Optimal staging activates only the units needed to meet current demand plus redundancy requirements. Poor staging runs all units continuously at partial load, which is less efficient than running fewer units at higher load while keeping others in standby.
□ Fan Speed and Airflow
Check if cooling units use variable speed fans that adjust airflow based on actual cooling demand. Constant-speed fans waste energy during periods of lower heat load. Variable frequency drives (VFDs) on fans can reduce energy consumption by 30-50% compared to constant-speed operation.
□ Cooling Unit Maintenance
Inspect filters, coils, and heat exchangers for cleanliness. Dirty filters restrict airflow, forcing fans to work harder. Dirty coils reduce heat transfer efficiency, requiring longer run times to achieve the same cooling effect. Regular cleaning (quarterly or as needed based on conditions) maintains rated capacity and efficiency.
□ Refrigerant Levels and System Performance
For systems using refrigerants, verify proper charge levels and system pressures. Low refrigerant charge reduces capacity and efficiency. Check for refrigerant leaks, which not only reduce performance but may violate environmental regulations.
4. Chilled Water Systems (If Applicable)
For facilities using chilled water cooling, the chiller plant represents a significant portion of total cooling energy consumption.
□ Chilled Water Supply Temperature
Measure chilled water supply temperature leaving chillers. Many facilities operate at unnecessarily low temperatures (42-44°F), which requires more compressor energy. Raising chilled water temperature to 50-55°F (when compatible with cooling equipment) significantly reduces chiller energy consumption. Each 1°F increase in chilled water temperature typically saves 1.5-2% in chiller energy.
□ Chiller Sequencing
Evaluate how multiple chillers are staged to meet varying loads. Operating chillers at or near their design capacity is more efficient than running multiple chillers at partial load. Ensure control logic optimizes chiller loading based on current efficiency curves.
□ Condenser Water Temperature
For water-cooled chillers, check condenser water temperature and cooling tower operation. Lowering condenser water temperature (within equipment limits) improves chiller efficiency. Verify that cooling towers operate properly and water treatment prevents scaling that reduces heat transfer.
□ Pump Efficiency
Assess chilled water and condenser water pumping systems. Variable speed pumps that adjust flow based on demand consume significantly less energy than constant-speed pumps. Check that pumps aren’t oversized for actual system requirements.
□ Free Cooling Opportunities
Determine if the facility takes advantage of economizer cycles or water-side economizer systems during cooler weather. Free cooling uses outside air or water temperatures to provide cooling without running mechanical chillers, dramatically reducing energy consumption during applicable periods. Facilities in appropriate climates can save 20-40% on annual cooling costs through economizer implementation.
5. Environmental Monitoring and Controls
Effective monitoring provides the data needed to optimize cooling systems and identify developing problems before they cause failures.
□ Sensor Coverage
Verify that temperature and humidity sensors are deployed throughout the facility, not just at cooling unit returns. ASHRAE recommends mounting sensors at six locations per rack (top, middle, bottom on both front and back). Without granular monitoring, hot spots and inefficiencies go undetected.
□ Sensor Accuracy
Calibrate sensors regularly (at least annually) to ensure accurate readings. Inaccurate sensors cause control systems to make poor decisions, potentially overcooling or creating hot spots. Even 2-3°F sensor error can result in significant energy waste across an entire facility.
□ Control System Integration
Evaluate whether cooling systems are controlled individually or through integrated building management systems (BMS) or data center infrastructure management (DCIM) platforms. Integrated control enables coordinated operation, preventing demand fighting and optimizing overall system performance.
□ Alarm Thresholds
Review temperature and humidity alarm set points. Alarms set too narrow create nuisance alerts that operators learn to ignore. Alarms set too wide may miss developing problems until equipment damage occurs. Set alarms based on equipment specifications and ASHRAE guidelines, with appropriate margins for action.
□ Trending and Analysis
Confirm that temperature, humidity, and energy consumption data are logged continuously and trended over time. Without historical data, it’s impossible to identify gradual degradation, evaluate the impact of changes, or optimize operations based on actual patterns.
6. Physical Infrastructure Assessment
The data center’s physical construction significantly impacts cooling efficiency.
□ Raised Floor Height and Plenum
For facilities using underfloor air distribution, verify adequate raised floor height (typically 24-36 inches minimum). Insufficient plenum depth restricts airflow and increases pressure drop, forcing fans to work harder. Inspect the underfloor plenum for obstructions, debris, or equipment that impedes airflow.
□ Ceiling Plenum and Returns
Check that hot air return paths are unobstructed. If using ceiling plenums for return air, verify that lights, cable trays, and other equipment don’t create excessive restrictions. Poor return paths can cause pressure differentials that force hot air to recirculate into cold aisles.
□ Building Envelope
Inspect for air infiltration from outside or from adjacent spaces. Unsealed doors, windows, or wall penetrations allow warm, humid outside air to enter, adding to cooling load. Weather-stripping, air curtains at doors, and proper sealing of penetrations reduce this parasitic load.
□ Lighting Heat Load
Evaluate lighting systems. Traditional lighting generates significant heat that cooling systems must remove. LED retrofits reduce both lighting energy consumption and cooling load. Some facilities have achieved 2-3% cooling energy savings through lighting upgrades alone.
7. Operational Practices
How the facility operates day-to-day significantly impacts cooling efficiency.
□ Server Utilization
Assess average server utilization rates. Servers running at 10-20% utilization still generate substantial heat. Virtualization and consolidation reduce the total number of physical servers needed, directly reducing heat load and cooling requirements. Modern data centers should target 60-80% average server utilization.
□ Equipment Decommissioning
Identify and remove “zombie” servers—equipment that’s powered on but no longer serving any function. Studies suggest 10-30% of data center servers fall into this category. These servers consume power and generate heat without providing value.
□ Equipment Lifecycle Management
Plan for regular hardware refreshes. Newer equipment typically provides more computing power per watt than older systems, reducing heat generation per unit of work performed. A five-year-old server might consume 300W to deliver performance that a new server achieves at 150W.
□ Scheduled Maintenance Programs
Confirm that preventive maintenance schedules exist and are followed for all cooling equipment. Deferred maintenance leads to gradual performance degradation that increases energy consumption. Regular maintenance (filter changes, coil cleaning, belt adjustments, refrigerant checks) maintains design efficiency.
□ Change Management Procedures
Verify that processes exist for evaluating cooling impact before deploying new equipment. Adding high-density servers or making significant configuration changes without considering cooling can create hot spots or overload existing capacity. Proactive planning prevents problems.
8. Documentation and Baseline Establishment
Effective auditing requires proper documentation to measure improvement.
□ Current Energy Consumption
Document current total facility power consumption, IT equipment power consumption, and calculated PUE. Measure during typical operating conditions to establish baseline values.
□ Cooling Energy Breakdown
Separate cooling energy consumption from other infrastructure loads (lighting, UPS, power distribution). This requires submetering or careful calculation but provides essential data for targeting improvements.
□ Equipment Inventory
Create or update complete inventories of cooling equipment including make, model, capacity, age, and condition. Include all cooling units, chillers, pumps, cooling towers, and related equipment.
□ As-Built Drawings
Verify that current facility drawings accurately reflect actual conditions. Many facilities have outdated drawings that don’t show recent modifications, making troubleshooting and planning difficult.
□ Historical Performance Data
Collect at least 12 months of historical energy consumption, temperature, and humidity data to understand seasonal variations and trends. This baseline enables measuring improvement and calculating return on investment for efficiency projects.
Prioritizing Improvements
After completing the audit, prioritize identified opportunities based on:
Implementation Cost: Some improvements (adjusting set points, installing blanking panels, repairing air leaks) require minimal investment while others (containment systems, new cooling equipment, controls upgrades) require substantial capital.
Energy Savings Potential: Quantify expected savings in kilowatt-hours and dollars. Focus first on opportunities with the highest savings potential.
Payback Period: Calculate simple payback (implementation cost / annual savings) to identify quick wins that pay for themselves in 1-2 years versus longer-term projects.
Risk and Complexity: Consider implementation complexity and potential risks. Adjusting temperatures requires careful monitoring but minimal risk. Major equipment changes require more planning and temporary capacity concerns.
Immediate Actions (Low-Cost, High-Impact):
- Install blanking panels in all unused rack spaces
- Seal floor openings and cable penetrations
- Verify and correct equipment orientation
- Adjust temperature set points upward incrementally
- Eliminate demand fighting through consistent set points
- Turn off unnecessary cooling units while maintaining redundancy
- Remove airflow obstructions
- Clean cooling equipment filters and coils
Medium-Term Projects (Moderate Investment):
- Implement hot aisle or cold aisle containment
- Install enhanced environmental monitoring
- Optimize perforated tile placement
- Deploy variable frequency drives on cooling equipment
- Upgrade to more efficient cooling technologies
- Implement economizer cycles
Long-Term Strategic Improvements (Higher Investment):
- Replace aging, inefficient cooling equipment
- Install liquid cooling for high-density racks
- Upgrade to advanced control systems
- Major infrastructure modifications
- Facility consolidation or migration
Measuring Success
After implementing improvements, measure results against baseline data:
PUE Improvement: Track PUE monthly and compare to baseline. Document progress toward efficiency goals.
Energy Consumption Reduction: Measure actual kilowatt-hour savings through utility bills or submetering. Calculate cost savings at current electricity rates.
Temperature Stability: Verify that equipment inlet temperatures remain within ASHRAE guidelines. Improvements should not create hot spots or reliability concerns.
Equipment Reliability: Monitor equipment failure rates, unplanned downtime, and maintenance requirements. Proper cooling optimization should maintain or improve reliability.
Continuous Improvement: Use ongoing monitoring to identify additional opportunities and prevent gradual degradation. Efficiency improvement should be an ongoing process, not a one-time project.
The Bottom Line
Cooling efficiency audits typically identify opportunities to reduce cooling energy consumption by 20-40% in facilities that haven’t previously focused on optimization. For a typical 1 MW data center with a PUE of 1.8, improving cooling efficiency to achieve a PUE of 1.5 would save approximately 300,000 kilowatt-hours annually—worth $30,000-$45,000 at typical commercial electricity rates.
Many of the highest-impact improvements require minimal capital investment. Installing blanking panels, sealing air leaks, adjusting set points, and eliminating demand fighting can often be completed for under $10,000 while delivering annual savings of $20,000-$40,000 or more.
Beyond direct cost savings, improved cooling efficiency provides additional benefits: reduced carbon footprint supporting sustainability goals, increased available capacity within existing infrastructure, improved equipment reliability through better thermal management, and enhanced ability to accommodate high-density computing requirements.
The hidden energy costs in most data centers are substantial, but they’re also addressable. This audit checklist provides the roadmap to identify where energy is being wasted and prioritize the improvements that will deliver the greatest return. The question isn’t whether your data center has cooling efficiency opportunities—it’s how quickly you’ll act to capture them.
Sources and Further Reading
Power Usage Effectiveness (PUE) and Metrics:
- AIRSYS North America – How Does Your Cooling System Affect Your Data Center’s PUE?
- Wikipedia – Power Usage Effectiveness
- 42U – PUE Calculator – What is PUE & How to Calculate
- AKCP – Optimizing PUE: Cut Data Center Costs & Boost Efficiency
- Google Data Centers – Power Usage Effectiveness
- TechTarget – What is PUE (Power Usage Effectiveness)?
- GIGABYTE – What is PUE and How is it Calculated?
- Vertiv – Quantifying the Impact on PUE When Introducing Liquid Cooling
- Submer – How to Calculate the PUE of a Datacenter
- Nlyte – What is PUE and How is it Calculated?
Airflow Management and Cooling Best Practices:
- Energy Star – Manage Airflow for Cooling Efficiency
- Volico Data Centers – Data Center Airflow Management Best Practices
- Energy Star – Raise the Temperature – Data Center Equipment
- Lawrence Berkeley National Laboratory – Cooling & Air Management
- ScienceDirect – Airflow Management Analysis to Suppress Data Center Hot Spots
- ACT – Data Center Cooling Systems: Tackling Heat in a Digital World
- Uptime Institute – Data Center Cooling Best Practices
- JEM Tech Group – Data Center Airflow Management
- Eziblank – The Hidden Costs of Poor Airflow in Data Centers
Audit Checklists and Best Practices:
- Lifeline Data Centers – The Essential Checklist for a Data Center Cooling System Audit
- BrightStar Systems – Data Center Best Practices Checklist
- Lawrence Berkeley National Laboratory – Tools for Data Center Efficiency
- Encor Advisors – Data Center Best Practices: The Complete Guide
- AIRSYS North America – Cooling Regulations for Data Center Compliance
- CoreSite – 6 Best Practices for Optimizing Data Center Cooling
- Eziblank – Data Center Checklist
- ZPE Systems – Data Center Temperature & Humidity Best Practices: A Complete Checklist
- 174 Power Global – Data Center Energy Efficiency Best Practices That Cut Costs
- Device42 – A Detailed Guide to Enhancing Data Center Energy Efficiency